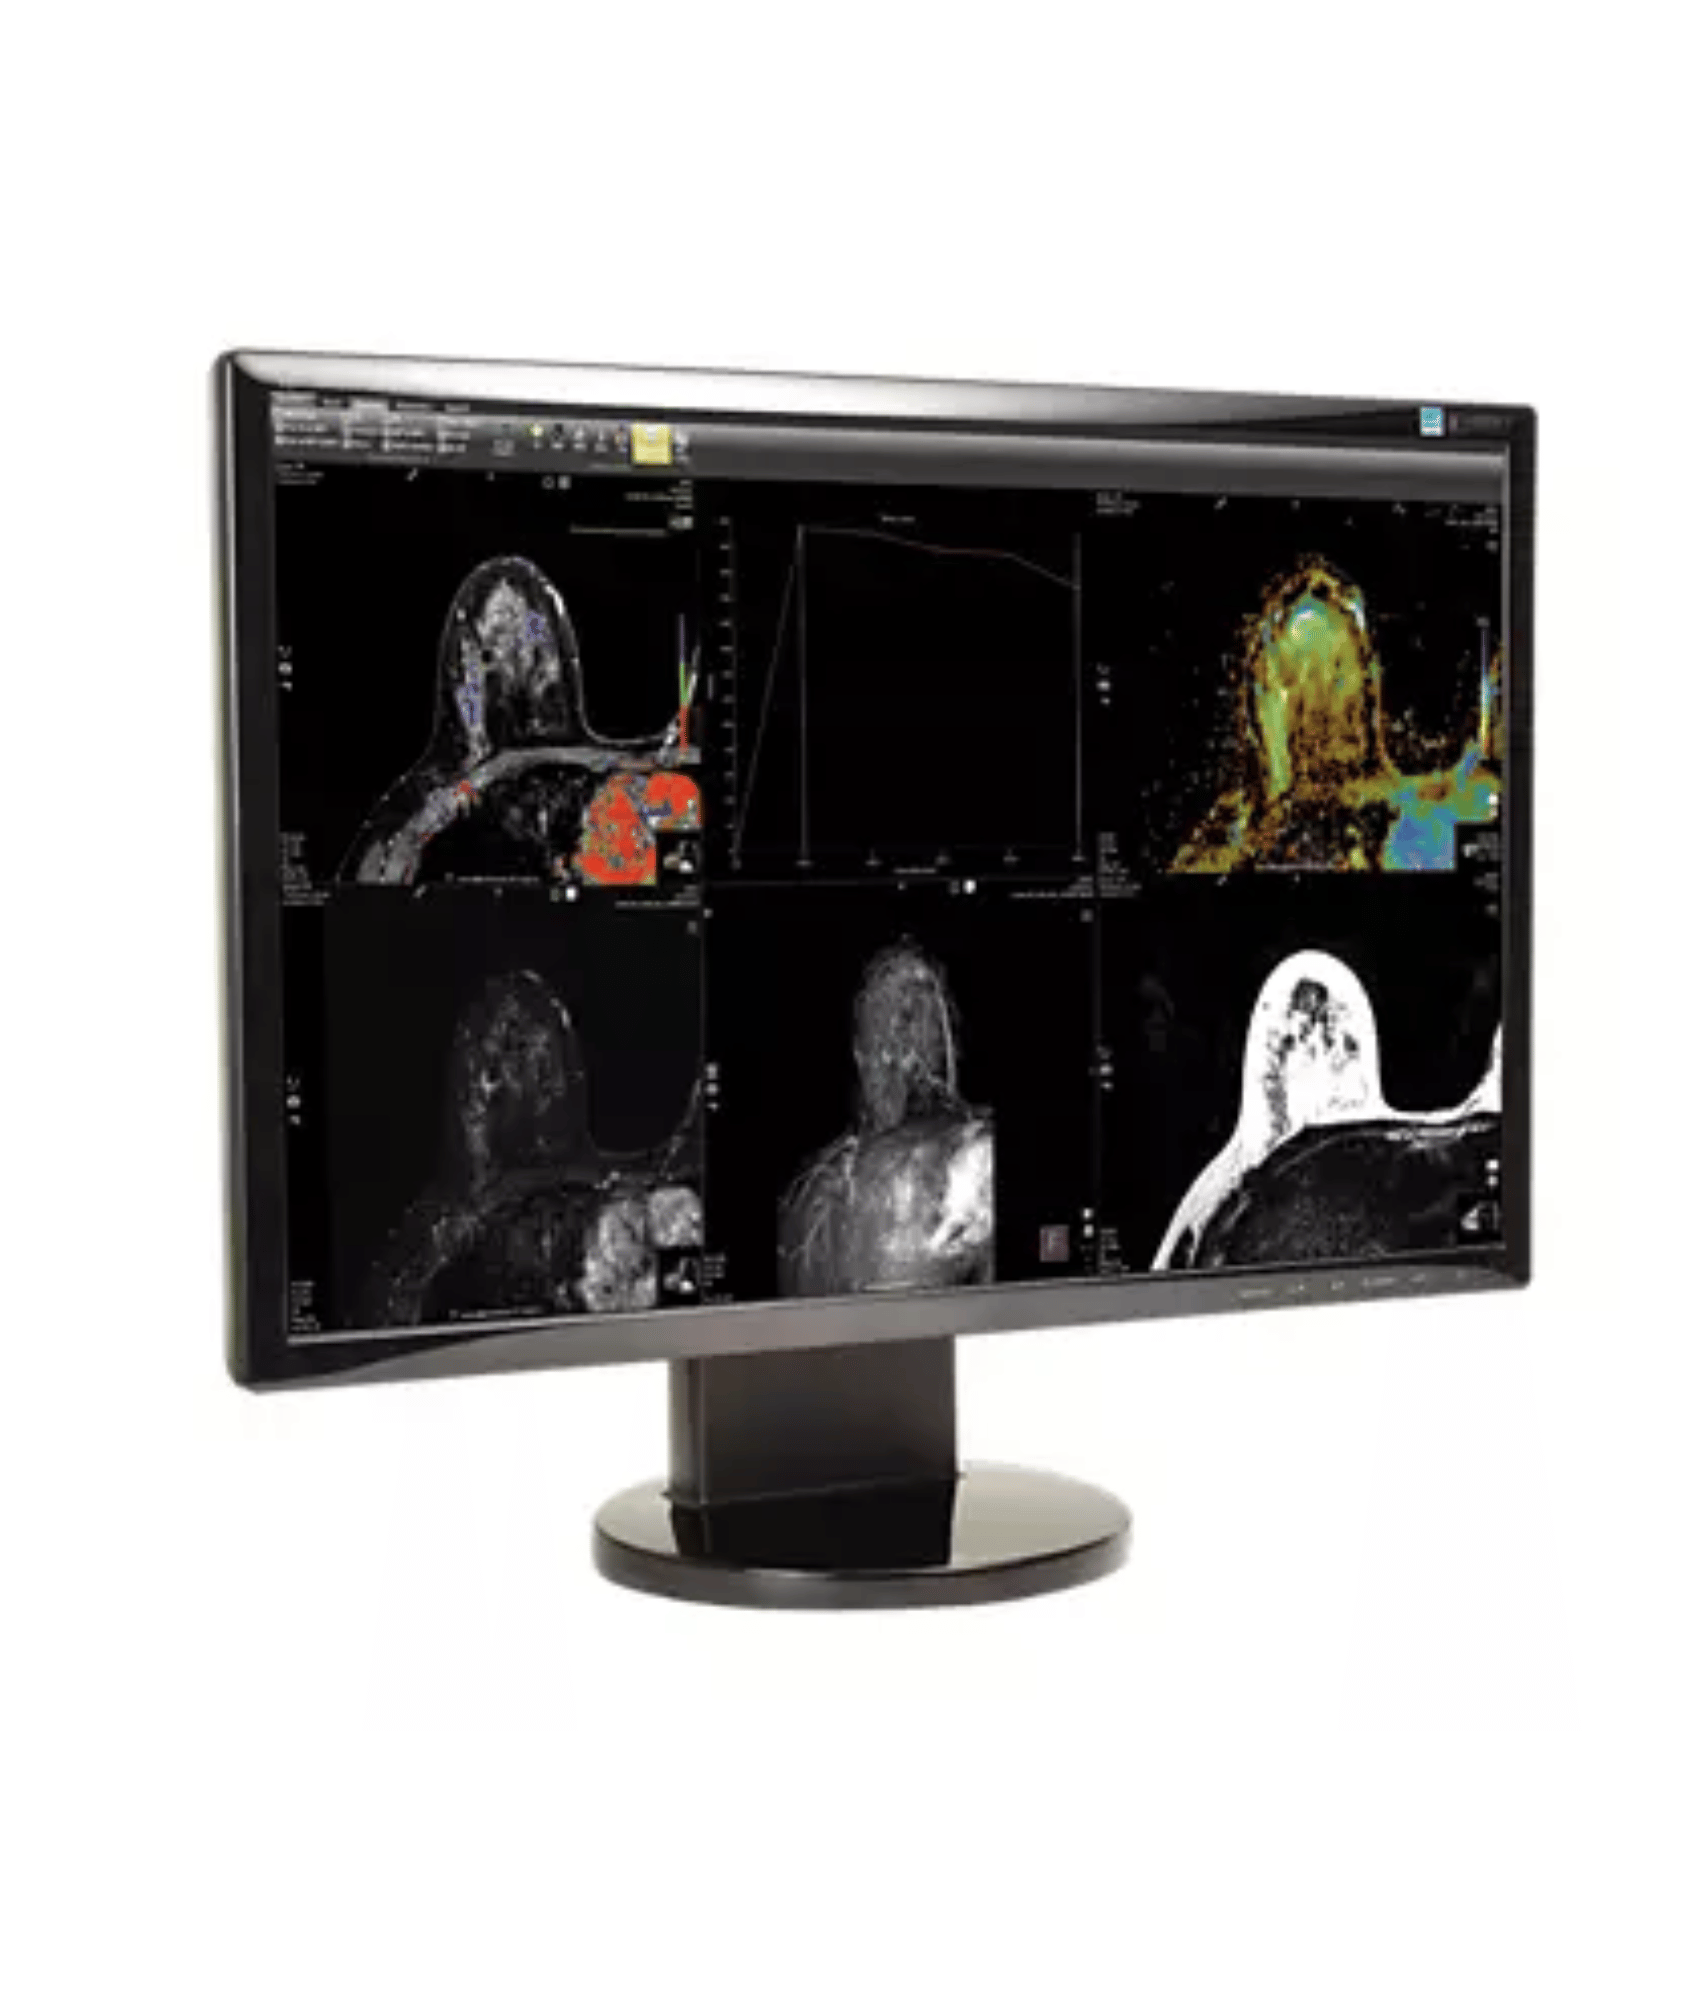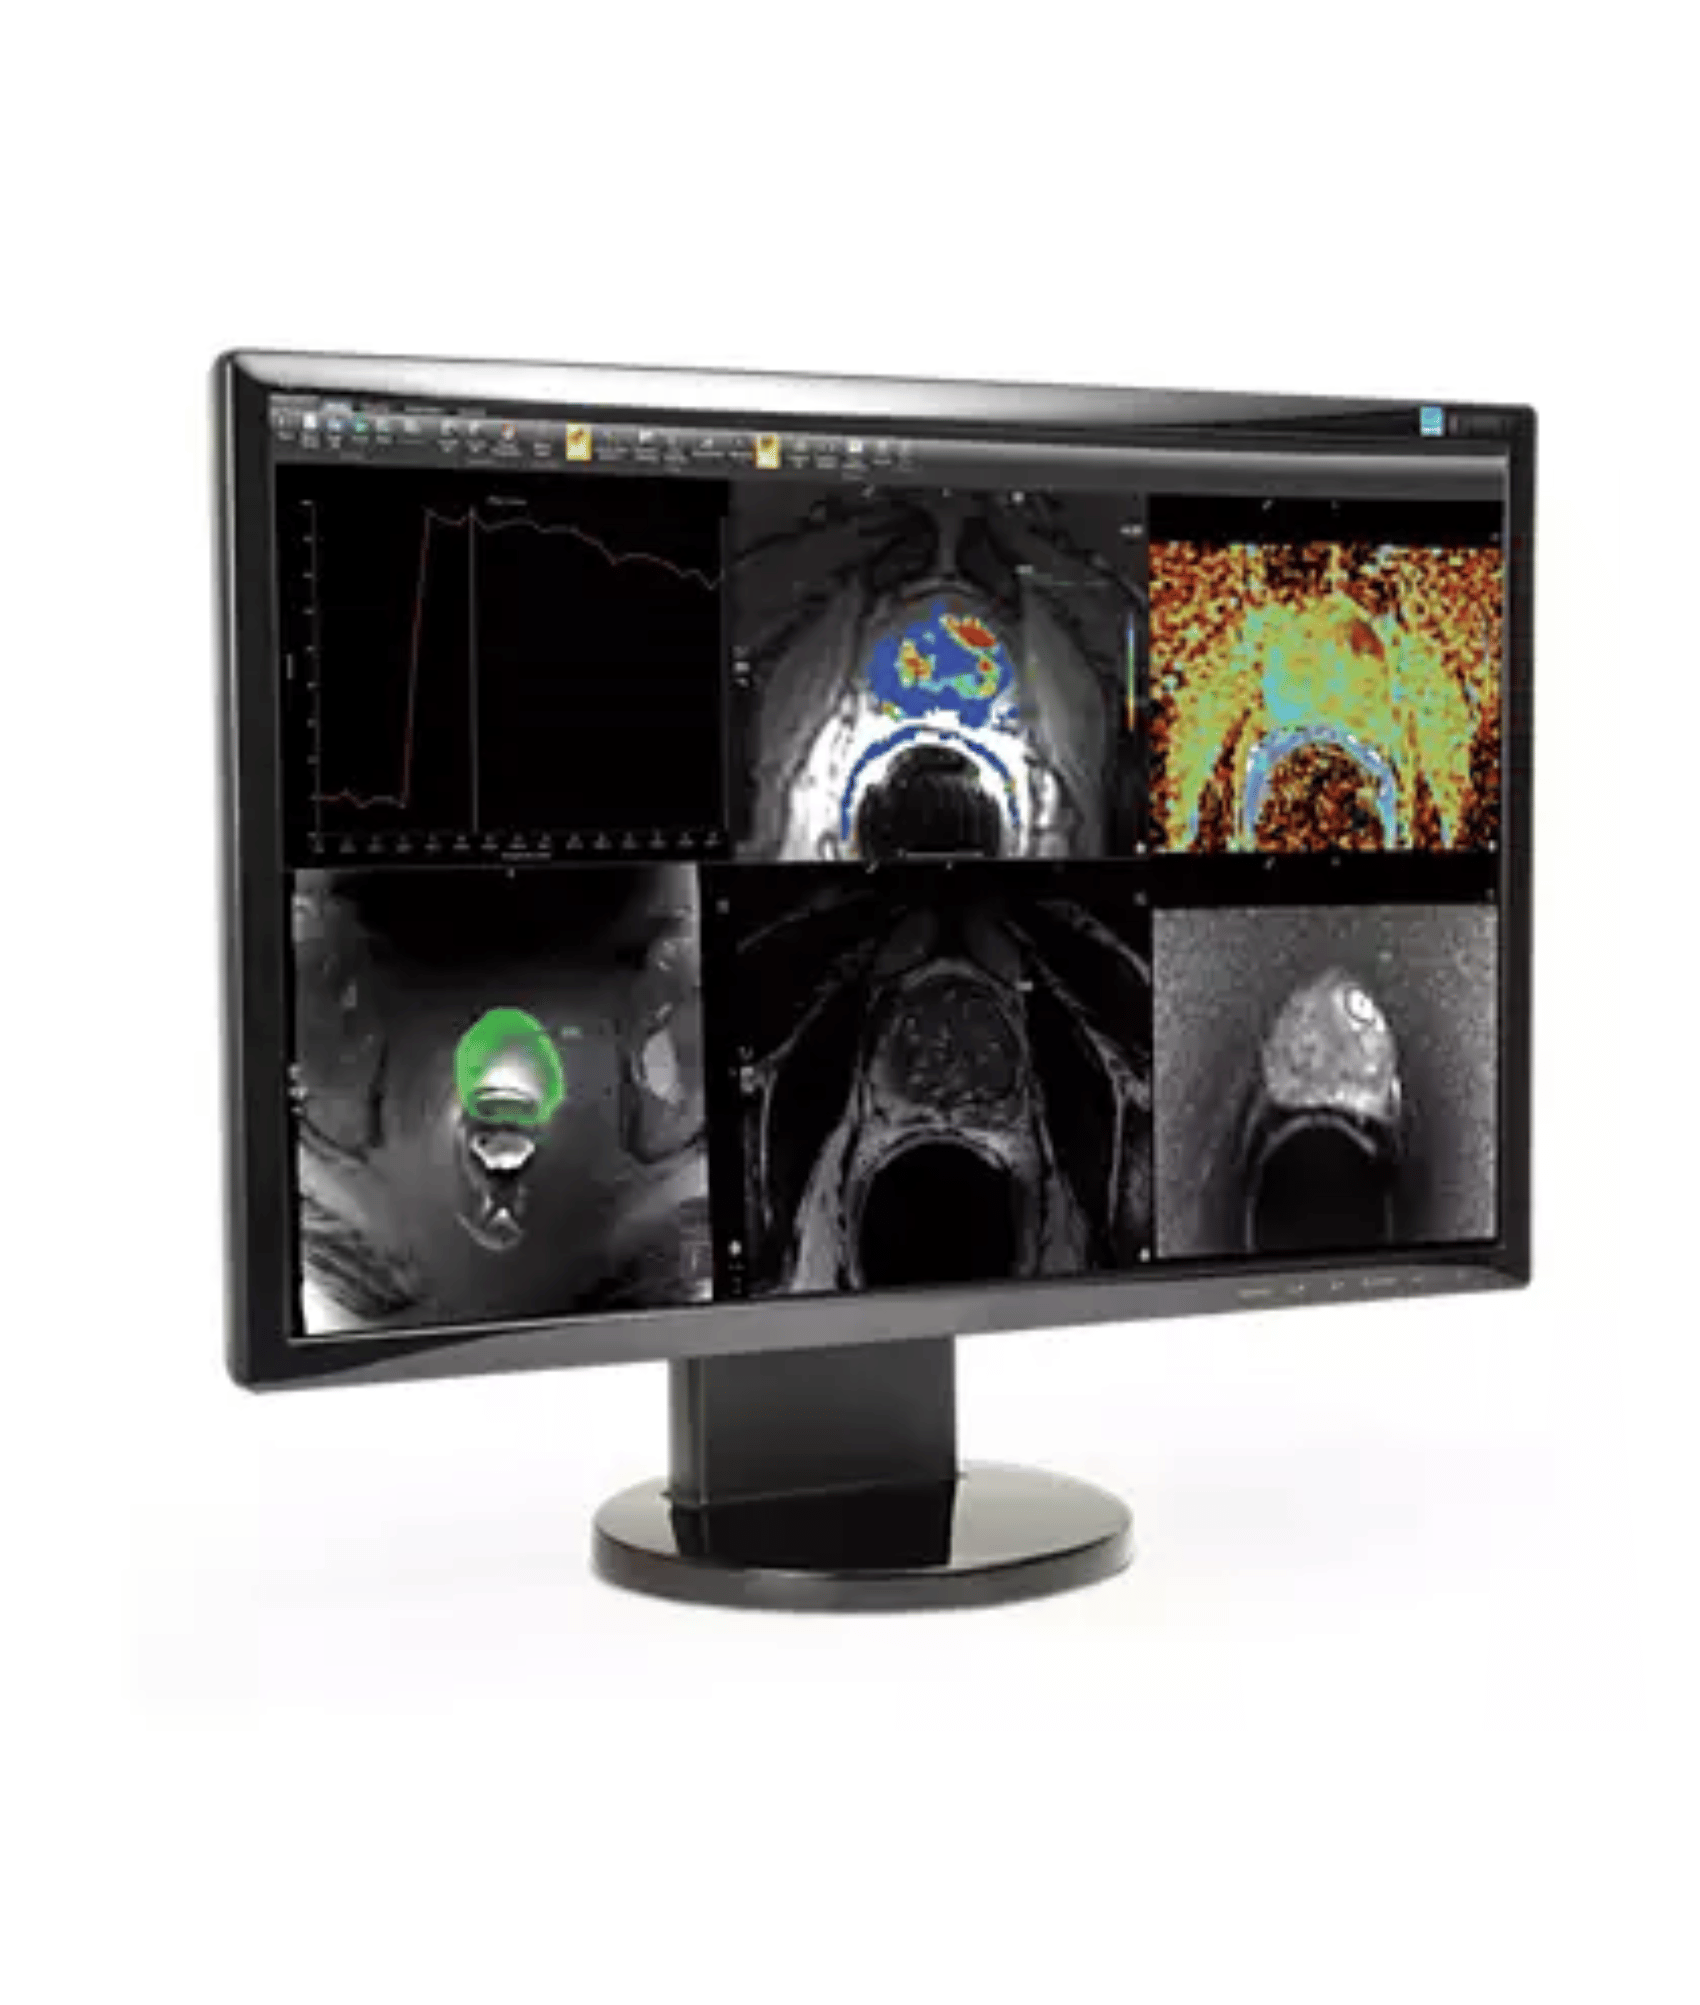
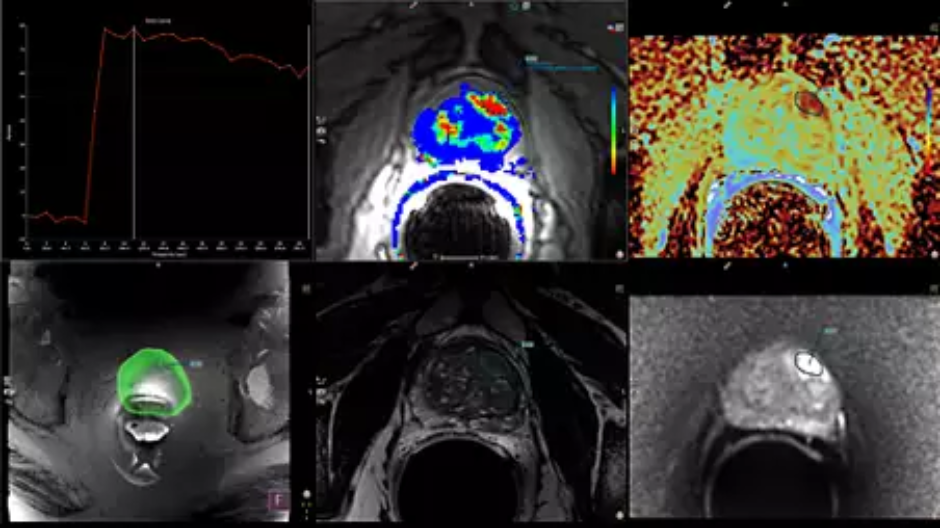
Enriched, multi-parametric exam reviews
With a powerful, easy-to-navigate, multi-vendor MR image analysis system, DynaCAD can quickly process and manage large volumes of data. You can open cases in ready-to-read, custom hanging protocols with all images synchronized for easy, multi-parametric review.
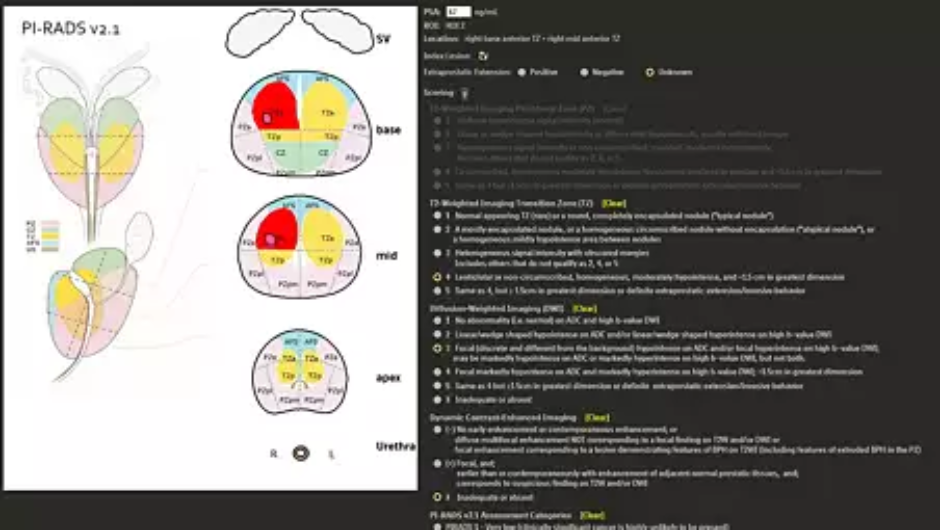
Interactive worksheets summarize study findings
PI-RADS® v2.1 interactive worksheets collate and classify data related to exam findings. Users can mark the finding locations within regional diagrams and utilize the PI-RADS® v2.1 lexicon to record their characteristics and grade severity – with automatic projection of the ROIs into the PI-RADS® sector map(s).
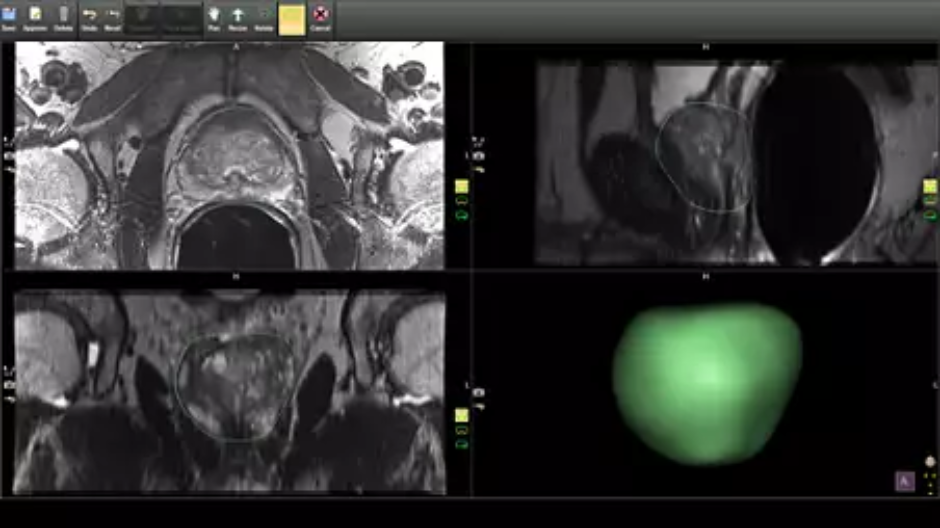
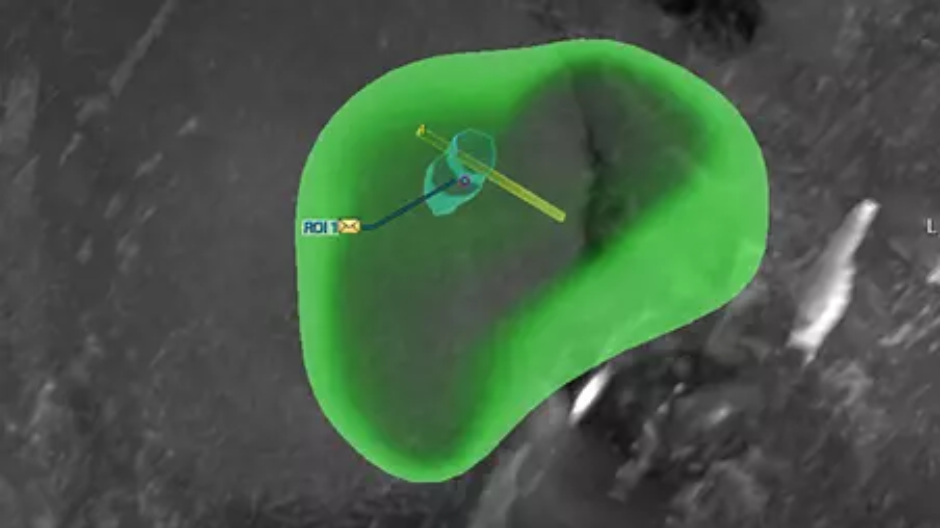
Adjustable 3D segmentations for optimally guided biopsies
You can reduce manual outlining of the prostate gland: DynaCAD Prostate’s model-based gland segmentation automatically performs a 3D segmentation of the gland. You can alter or adjust the segmented results in all three planes. The resulting segmentation reports overall gland volume and sets the stage for UroNav MR/US guided fusion biopsy procedures.
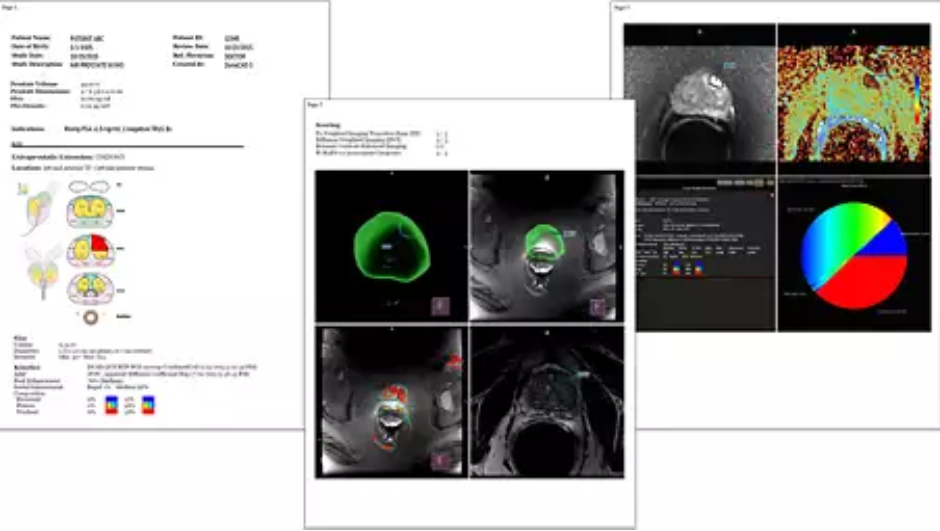
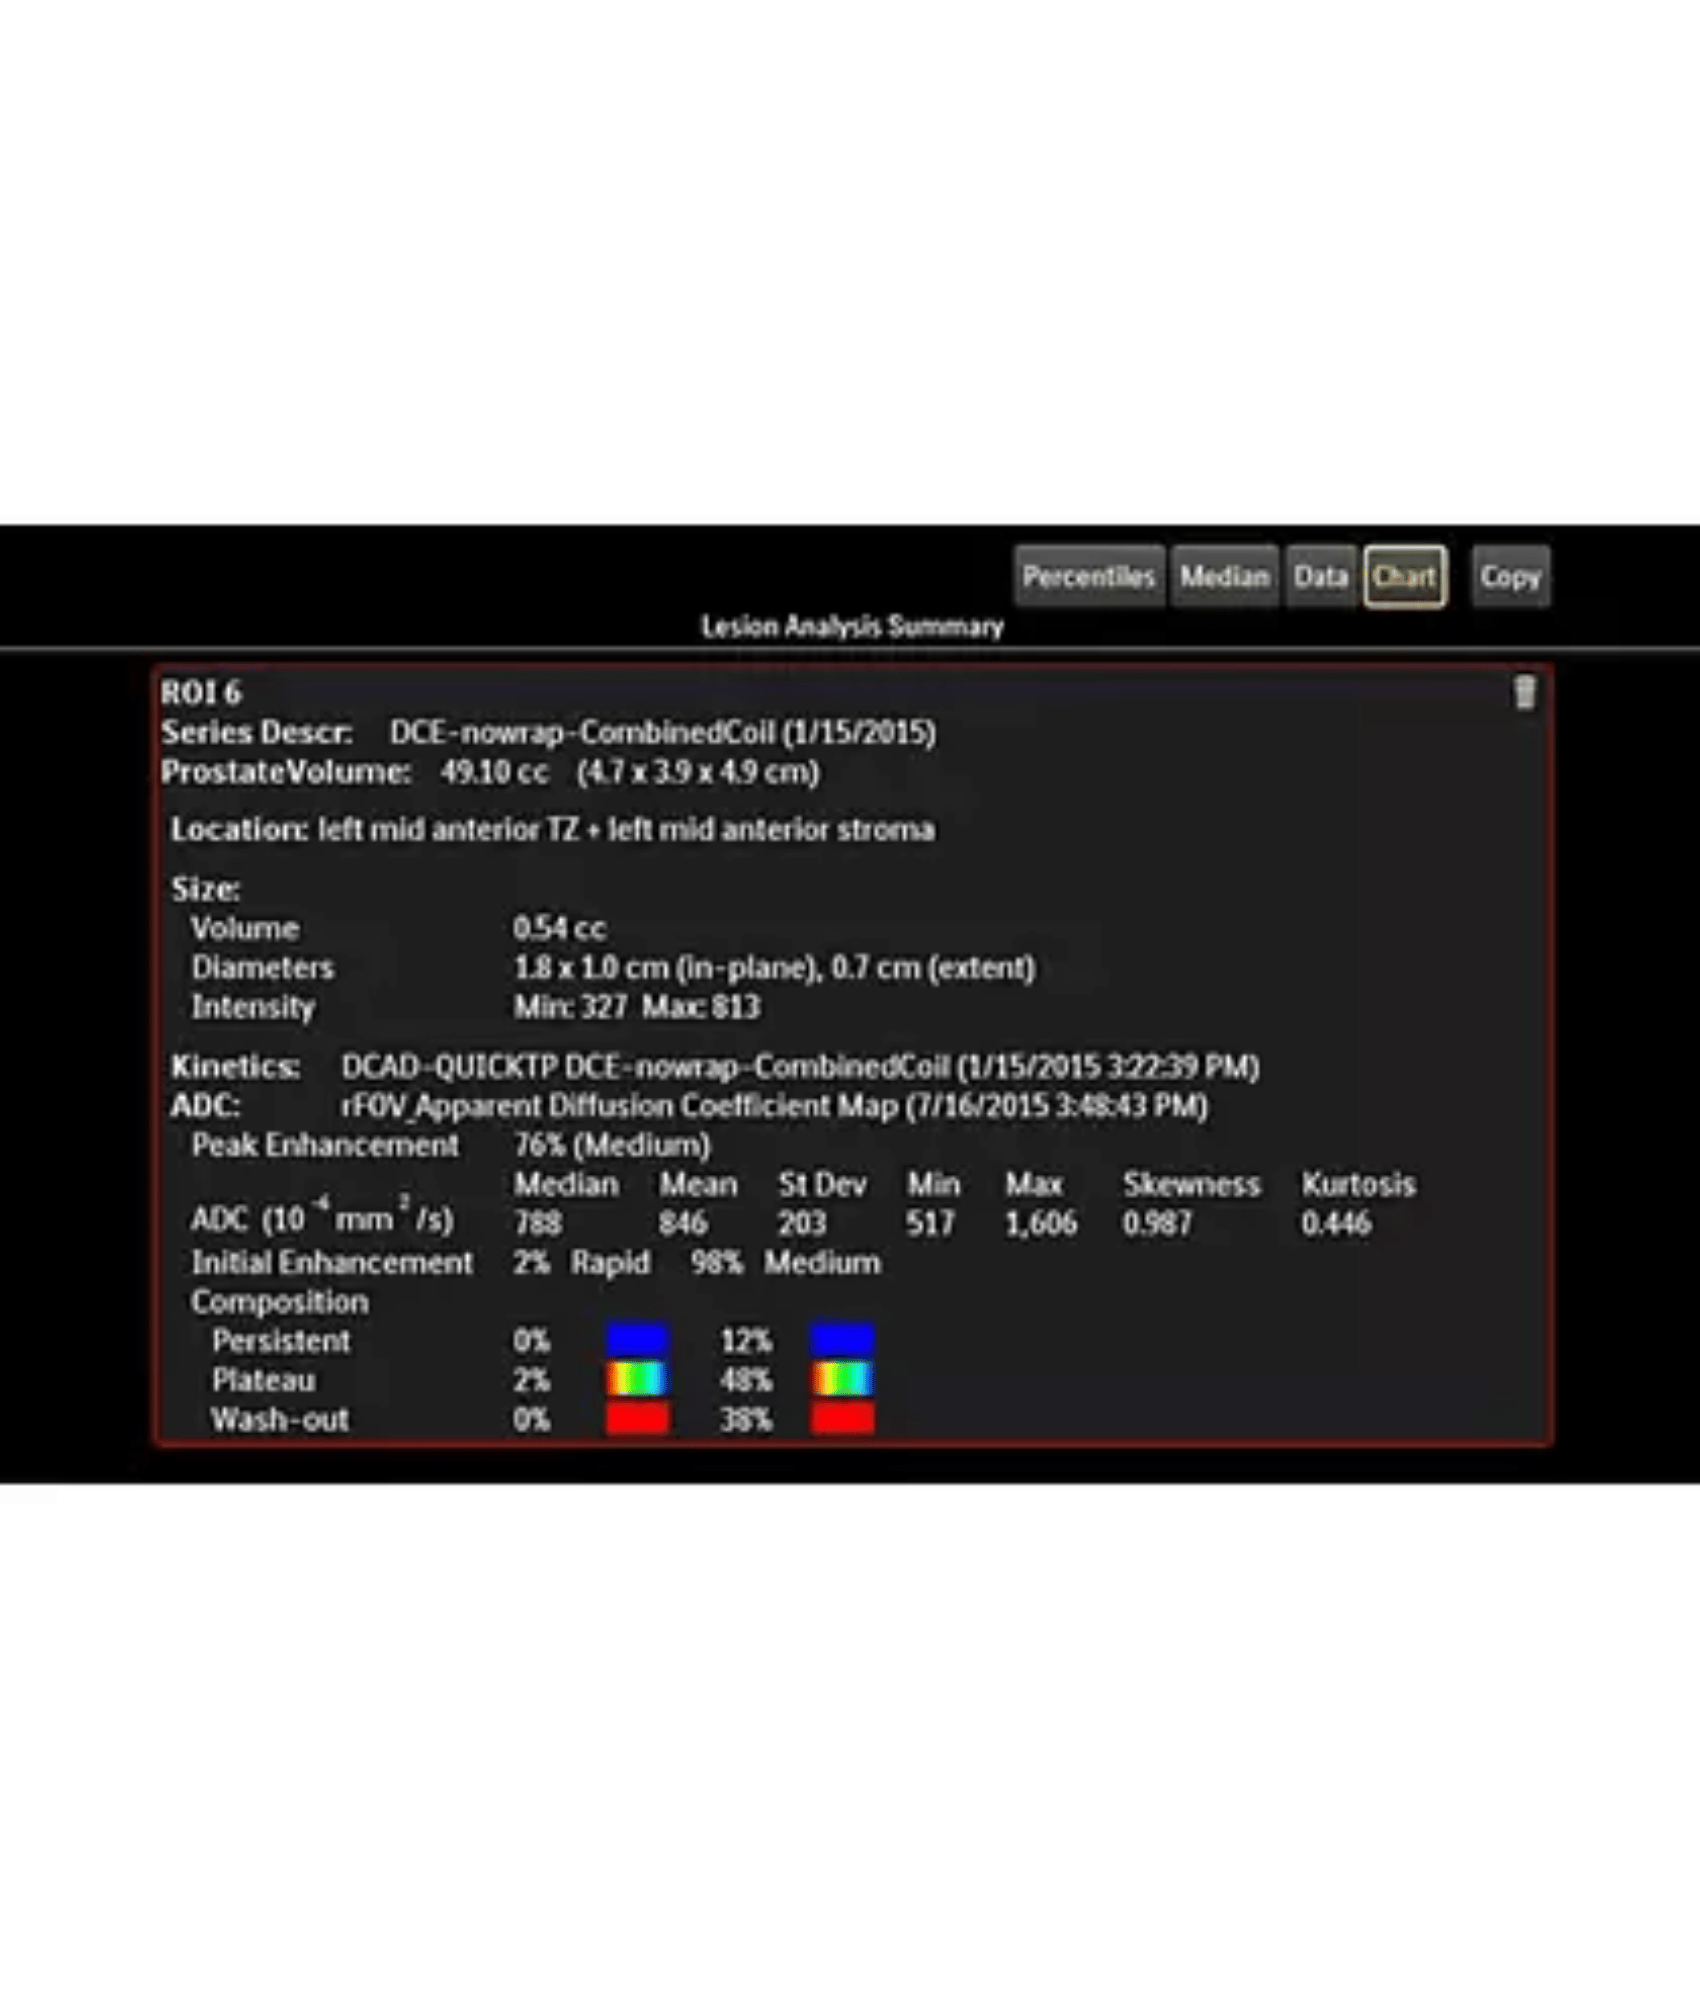
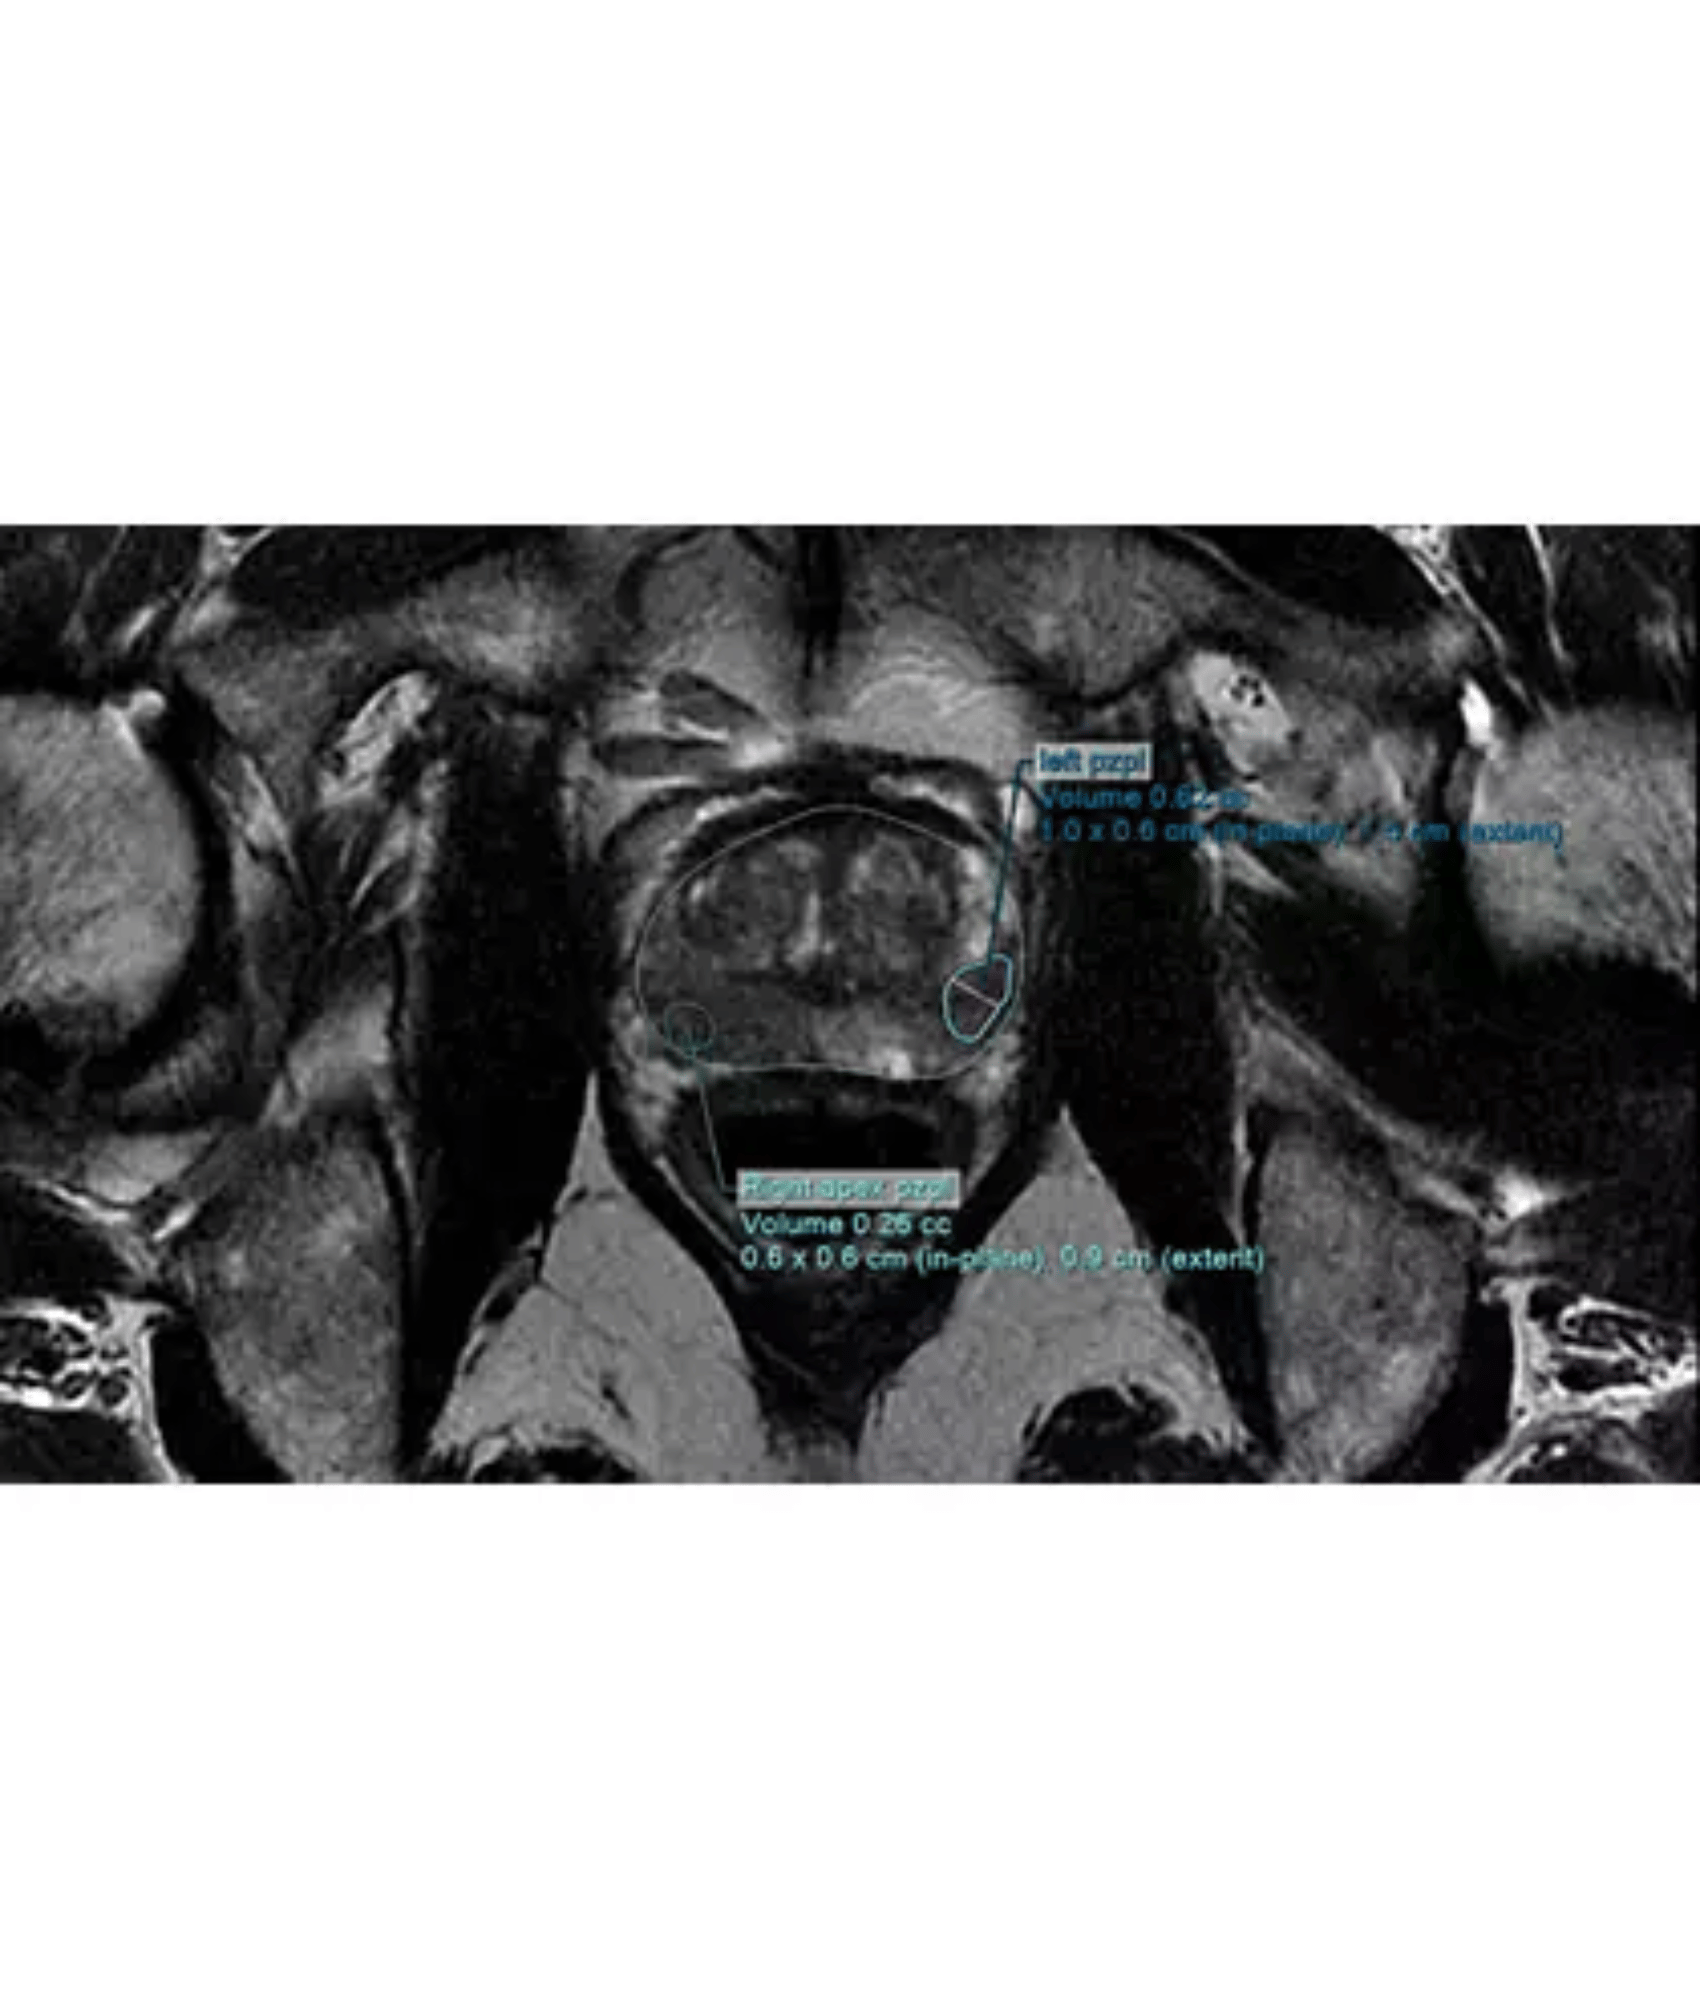
Exceptionally data-rich patient reports
You can set up patient reports to automatically capture pre-selected image sequences, kinetic curves, measurements, and annotations. Lesions are assessed according to PI-RADS® v.2.1 scoring and are automatically registered to the PI-RADS sector map as 2D projections. This data is incorporated into standardized reports. Upon completion, you can print patient reports, save as a PDF, or send as DICOM images.
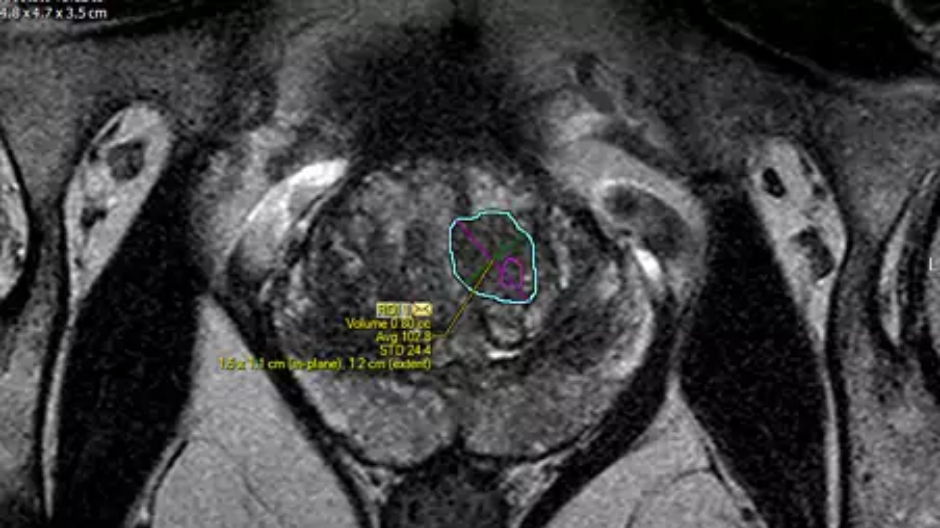
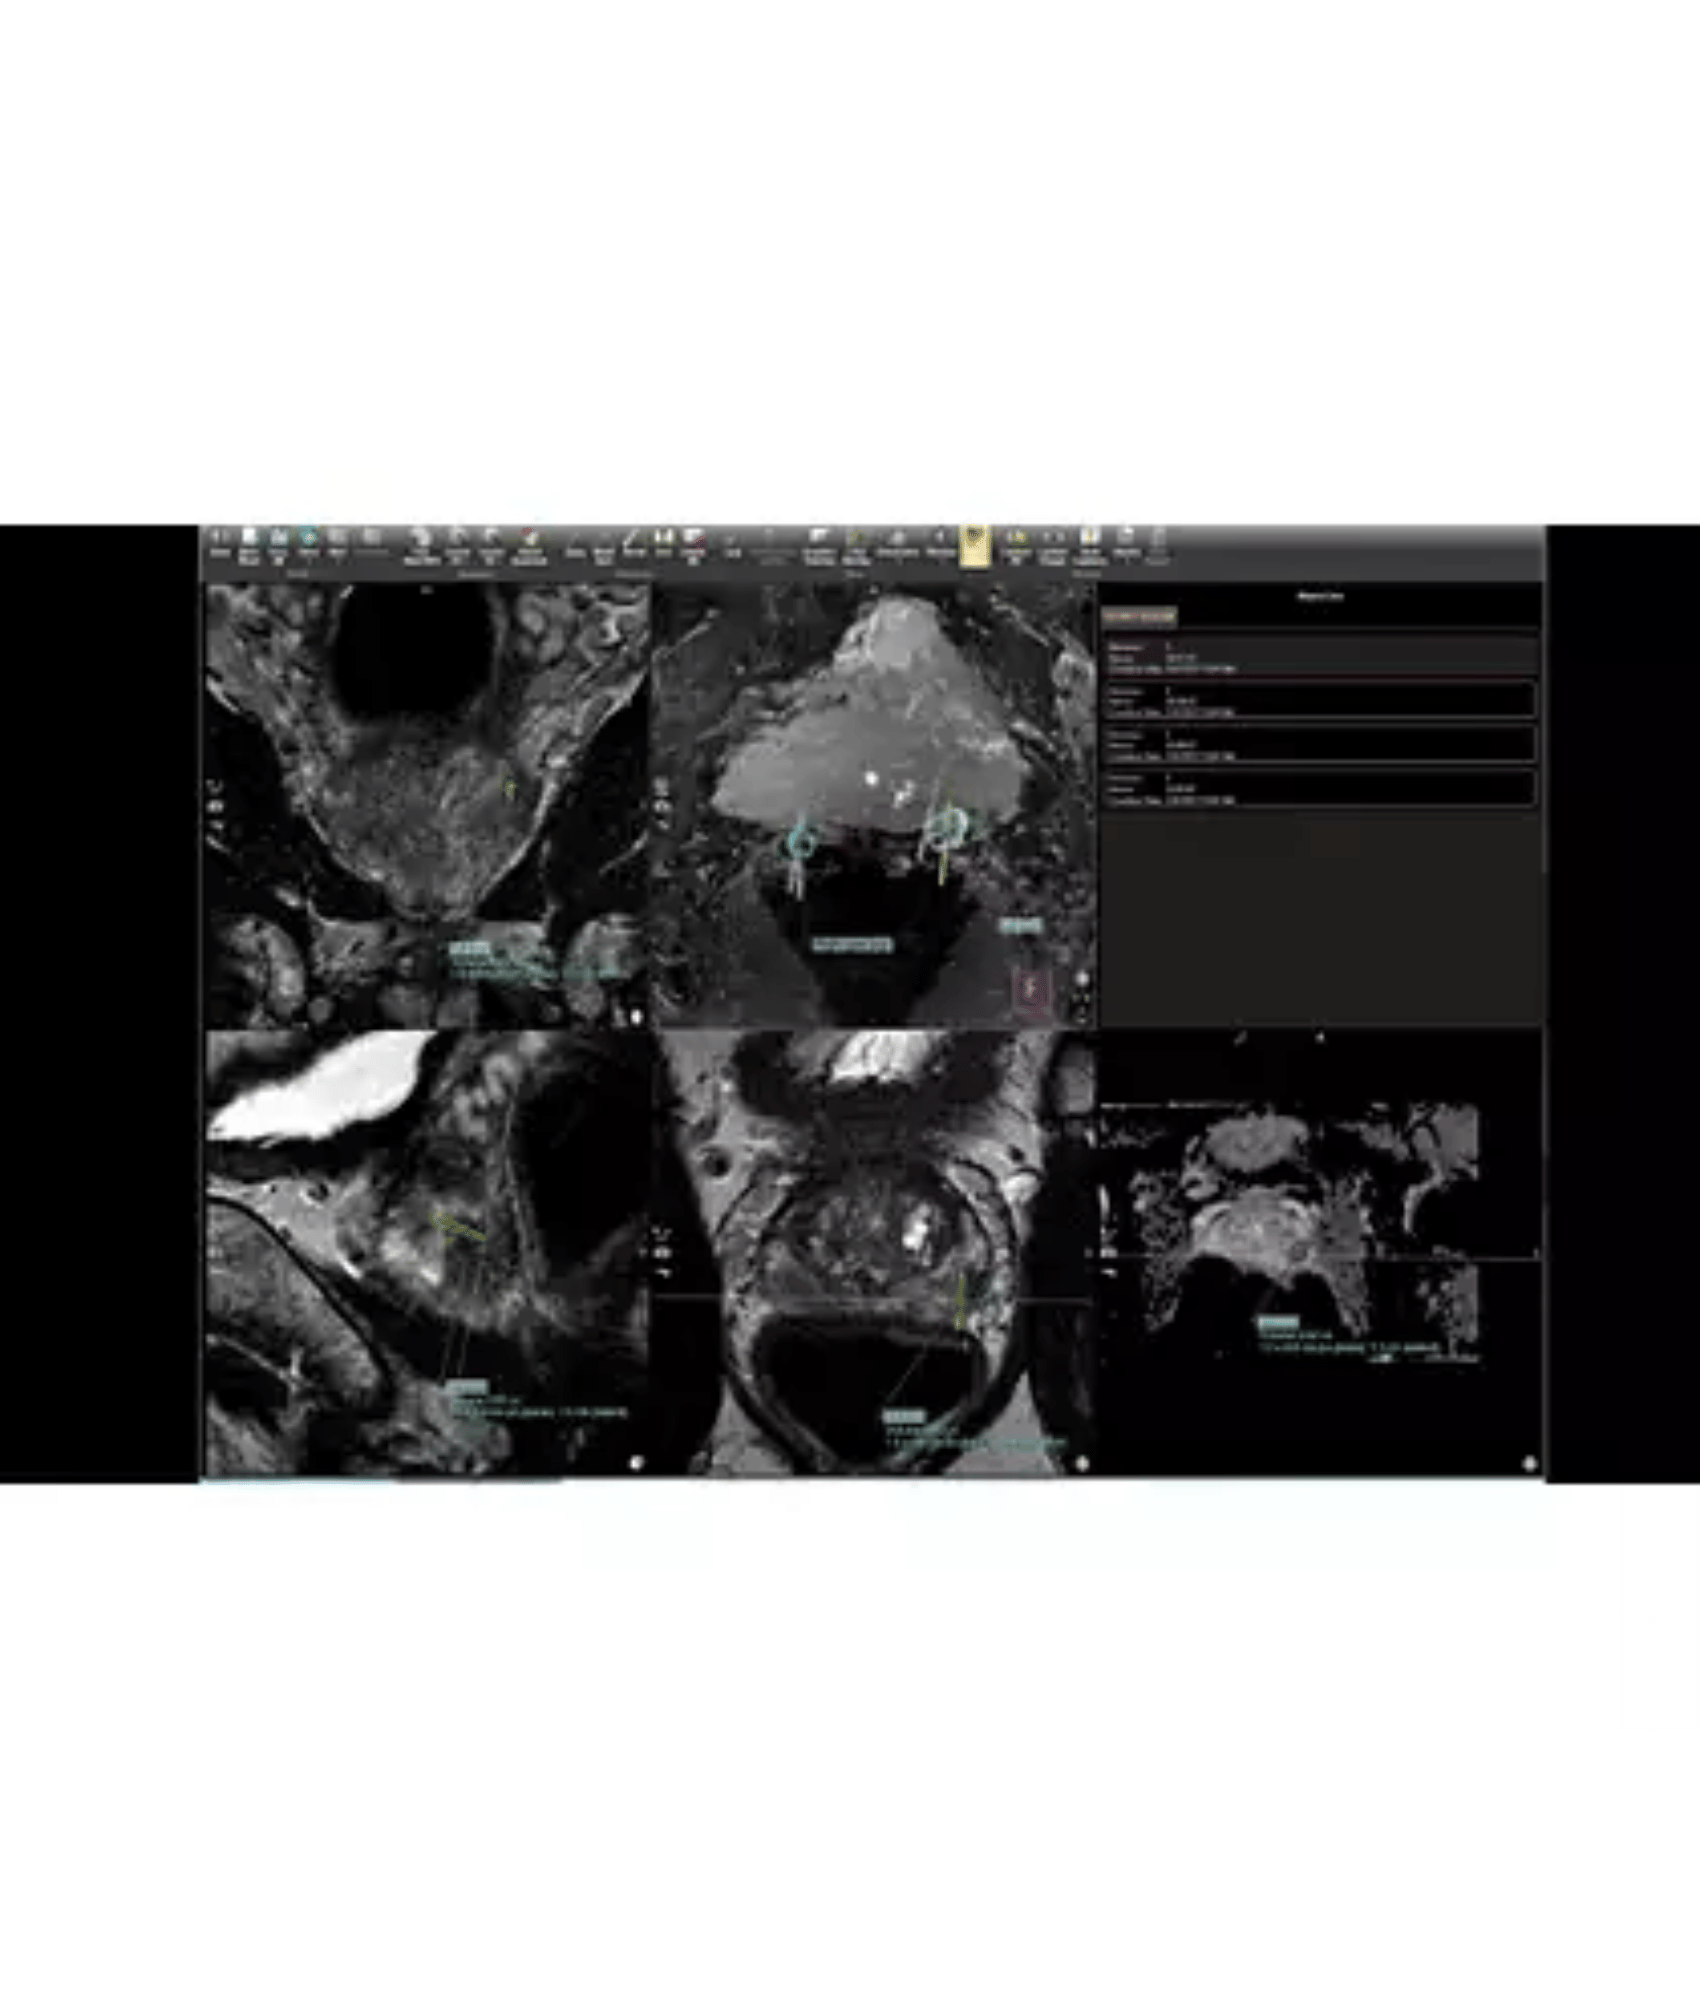
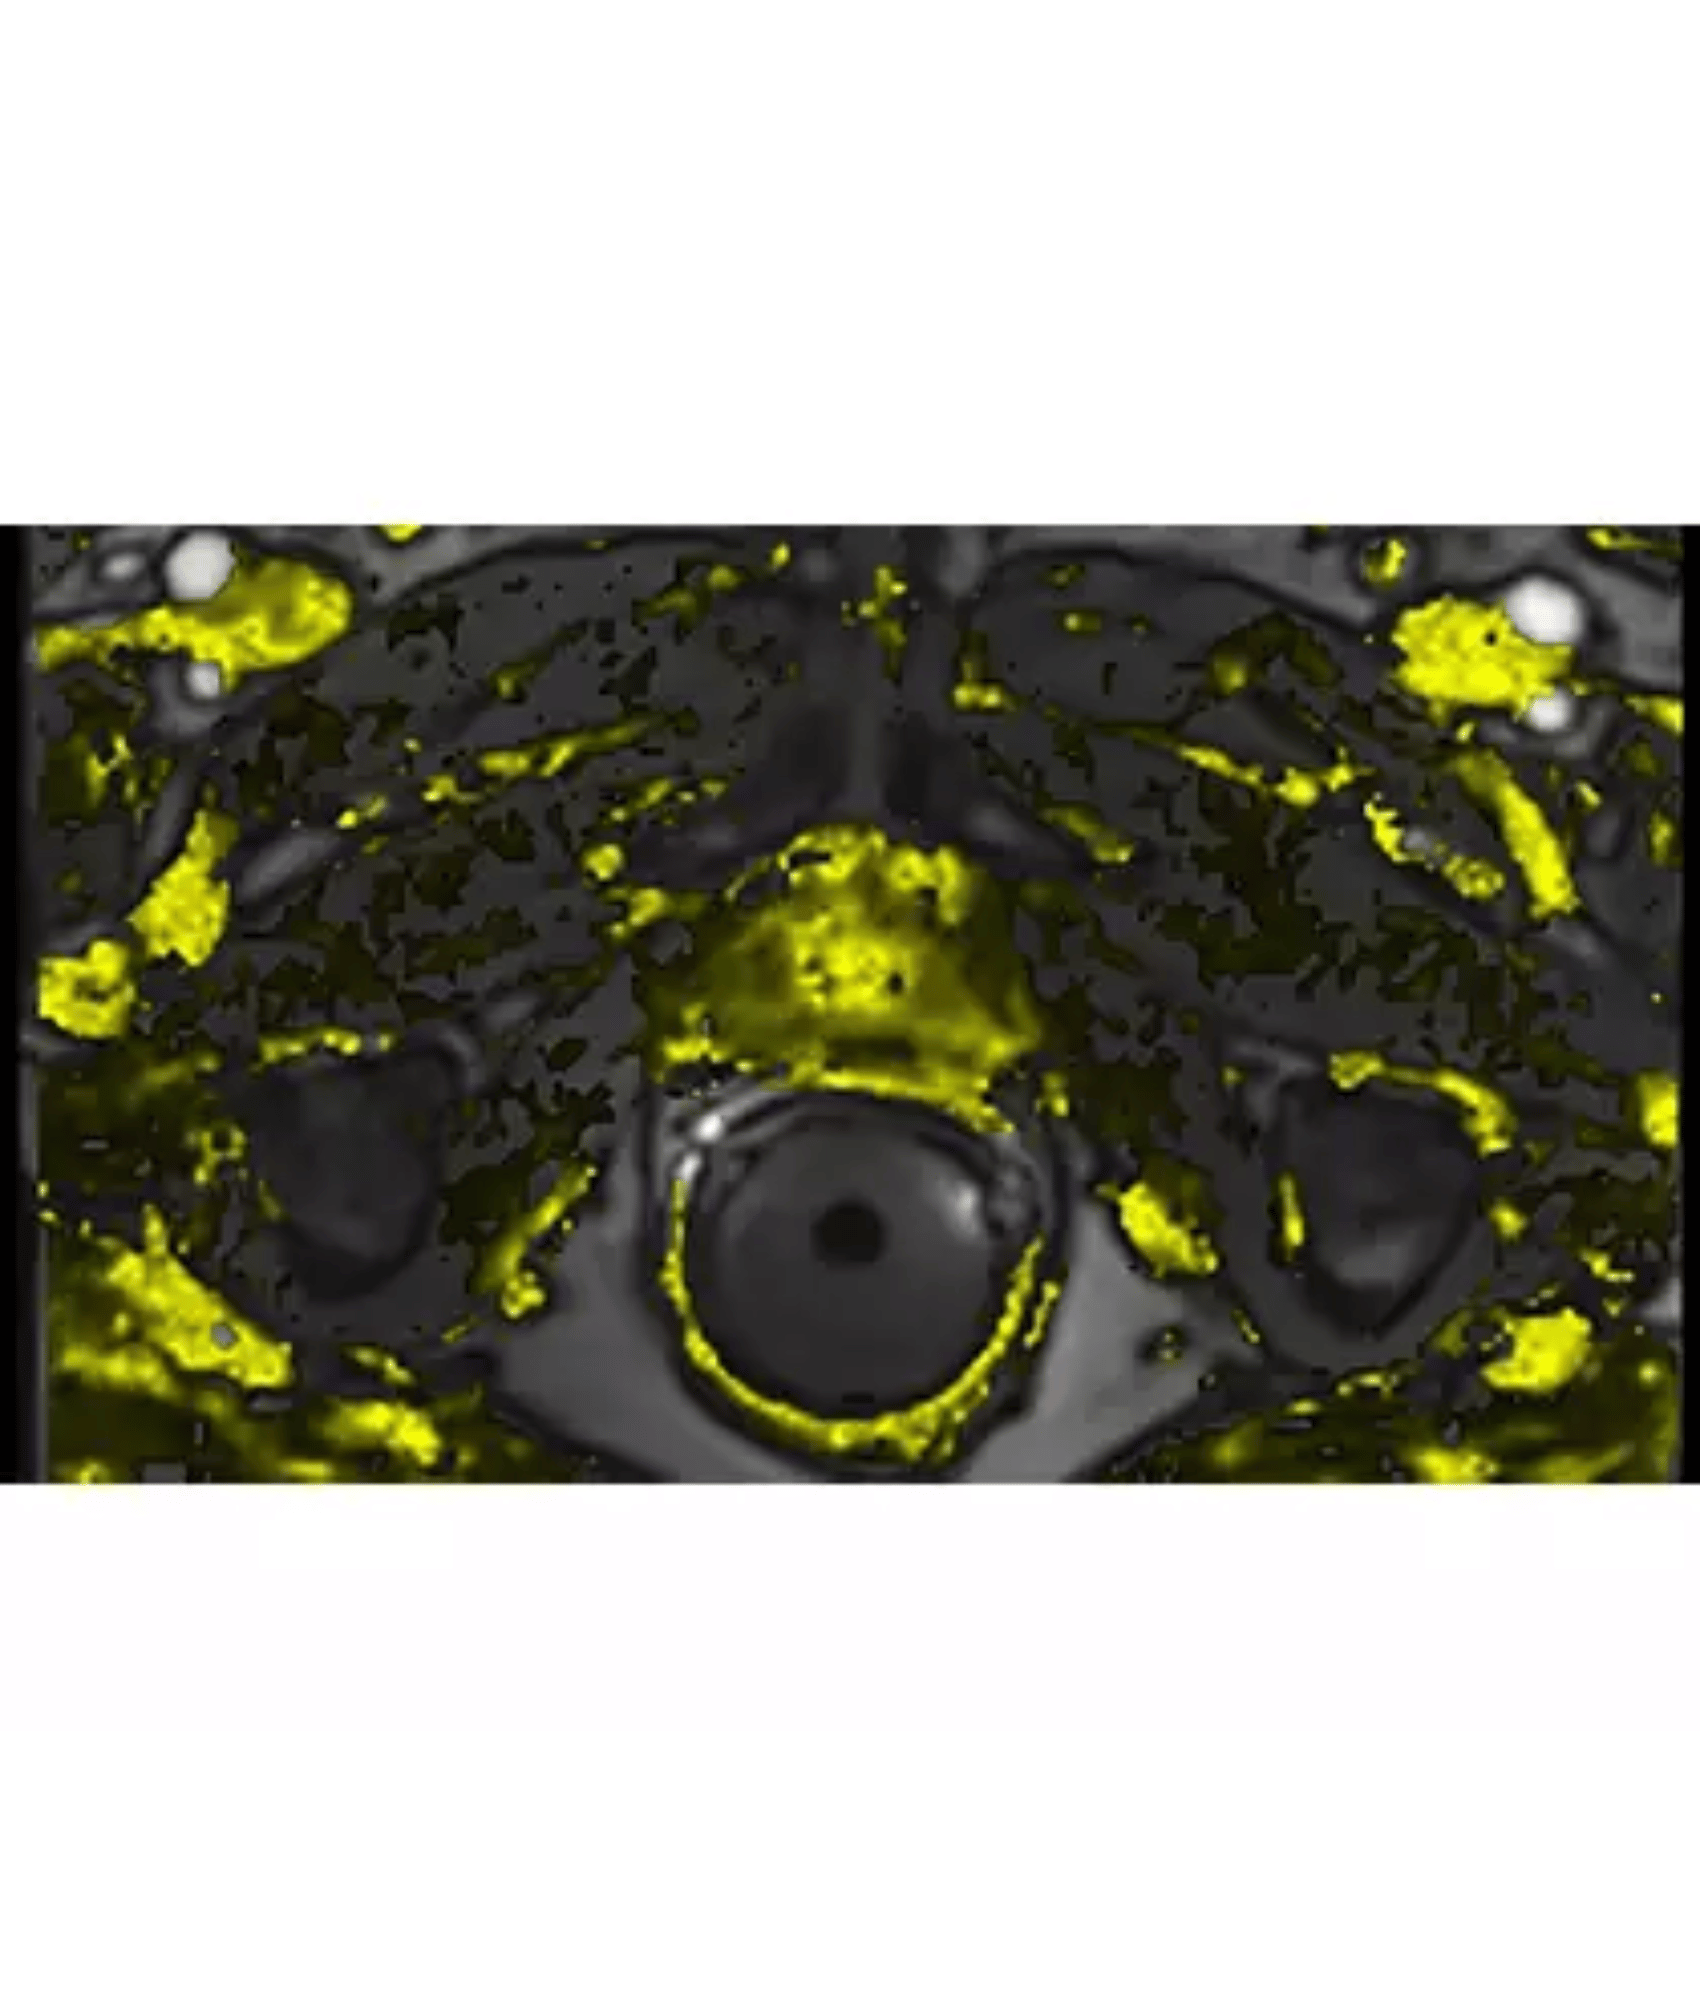
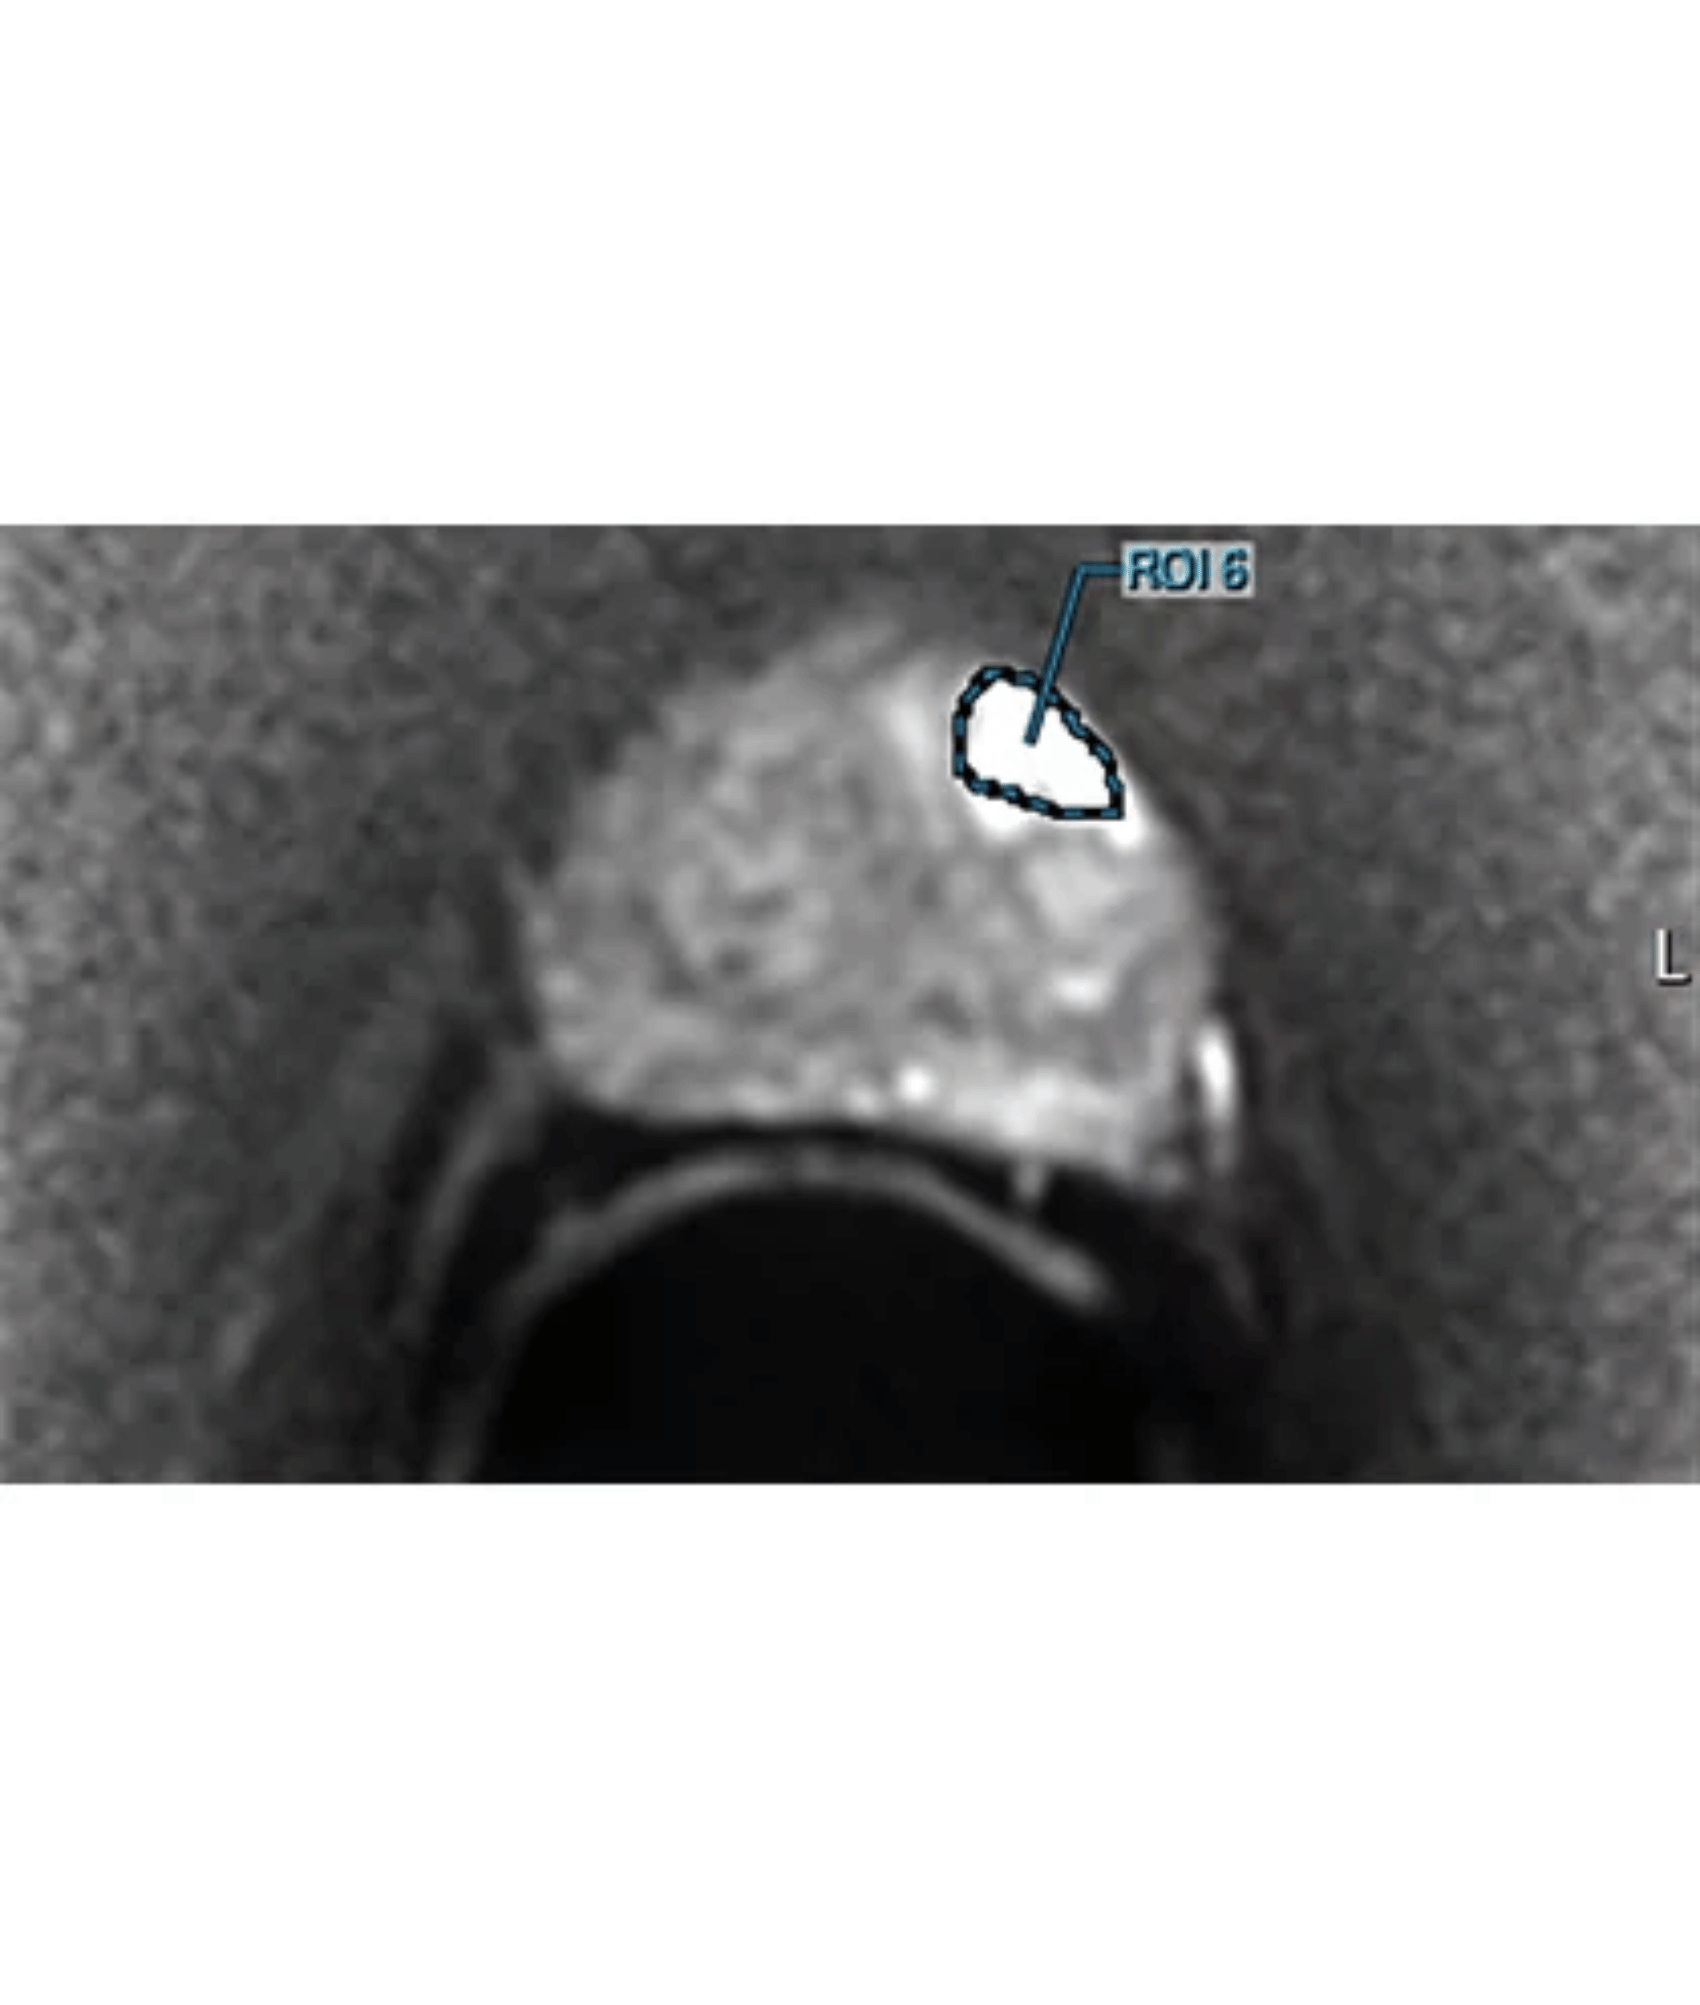
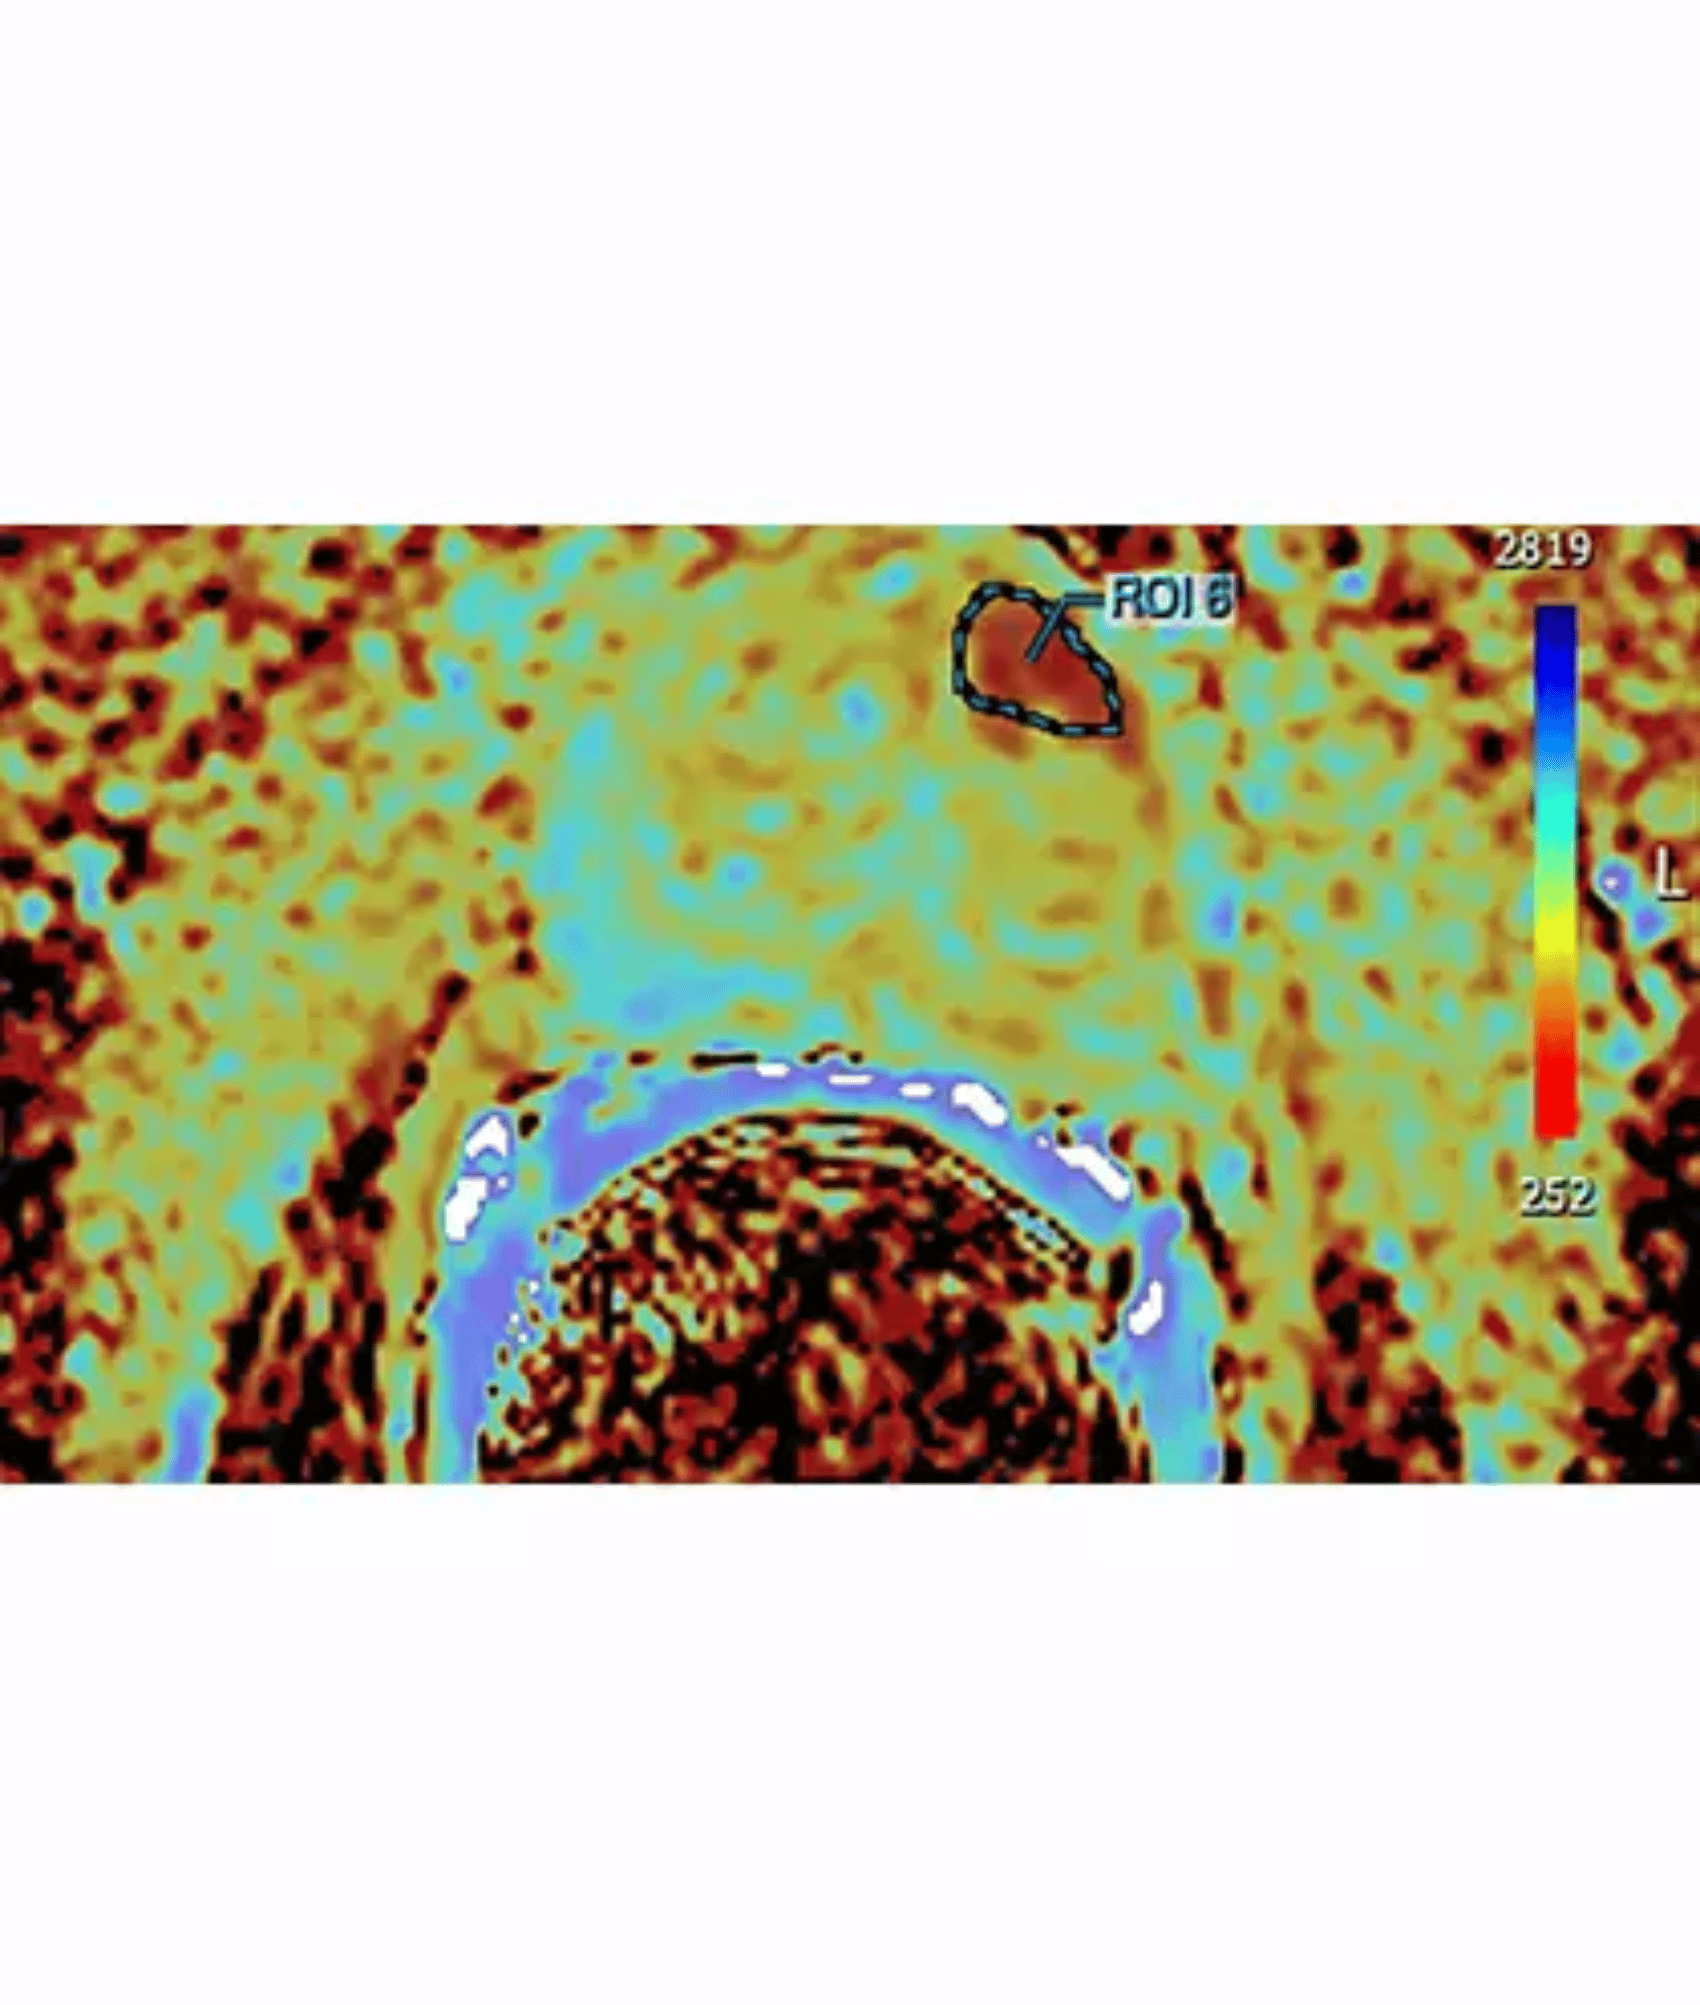
Enhanced targeting of ROIs
User generated ROIs can be displayed on a 3D model of the prostate as well as multiple image sequences from the study.
Overlays of previous biopsy targets provide valuable feedback
DynaCAD’s reverse fusion feature maps and displays earlier fusion guided biopsy locations. Users can view previous targets and cores produced by UroNav, allowing them to track accuracy.